
Dollar Index Above 103: Multinational Revenue Impact
A dollar index consistently above 103 significantly impacts multinational corporations, leading to reduced reported revenues, increased competitive pressures, and requiring strategic financial and operational adjustments to mitigate adverse effects.

Freight Transportation Services Index Drops 1.2%: U.S. Logistics Warnings
The recent 1.2% drop in the Freight Transportation Services Index (FTSI) serves as a critical economic warning, reflecting a contraction in U.S. logistics volume and hinting at broader economic shifts.
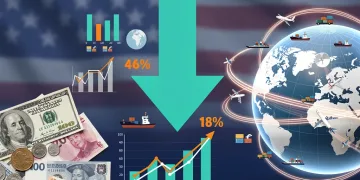
U.S. Trade Deficit Contracts by $4.5 Billion: An Economic Analysis
The U.S. trade deficit recently contracted by $4.5 billion, signaling significant shifts in global export demands and influencing the nation's economic landscape, impacting various sectors and international relations.
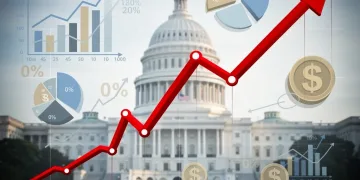
US Federal Budget Deficit Expands: Fiscal Constraints & Monetary Policy
The expanding federal budget deficit poses significant long-term fiscal constraints, directly influencing U.S. monetary policy decisions and potentially affecting the nation's economic stability and future growth trajectory.
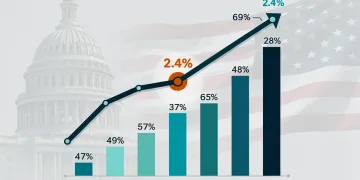
U.S. Inflation Stabilizes at 2.4%: Key Drivers Explored
The U.S. inflation rate has stabilized at 2.4%, reflecting a complex interplay of supply chain improvements, moderated consumer demand, and strategic Federal Reserve policies designed to achieve price stability.

Industrial Production Jumps 0.8%: Capacity Utilization Recovery
Industrial production in the United States has seen a significant 0.8% increase, indicating a strong recovery in capacity utilization nationwide. This growth reflects a revitalization of various sectors, contributing to overall economic stability and expansion.
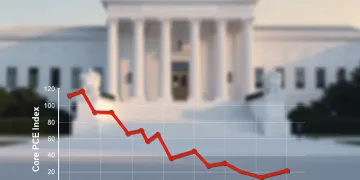
Core PCE Index Declines to 2.3%: Fed's Inflation Fight
The Core PCE Index declined to 2.3%, signaling potential progress in the Federal Reserve's efforts to achieve price stability, a crucial development for the U.S. economy.

Small Business Optimism Index Climbs 3 Points: Capital Investment Forecasts
The Small Business Optimism Index recently rose by 3 points, signaling a positive shift in entrepreneurial sentiment. This surge is expected to influence economic forecasts, particularly regarding capital investments and overall business expansion in the US.

Nonfarm Payrolls Exceed Expectations: 185,000 New Jobs & Economic Breakdown
The latest nonfarm payrolls report shows a robust increase of 185,000 new jobs, surpassing economic forecasts and signaling a resilient labor market in the United States amidst ongoing economic shifts and sector-specific dynamics.

10-Year Treasury Yield at 4.1%: A Paradigm Shift for US Markets
The 10-year Treasury yield at 4.1% signifies a profound shift in U.S. capital markets, altering investment valuations, corporate borrowing costs, and the broader economic landscape for investors and businesses alike.